Learn how balance sheets show assets, liabilities, equity, liquidity, leverage, and debt risk in company fundamental analysis.
What Is a Balance Sheet?
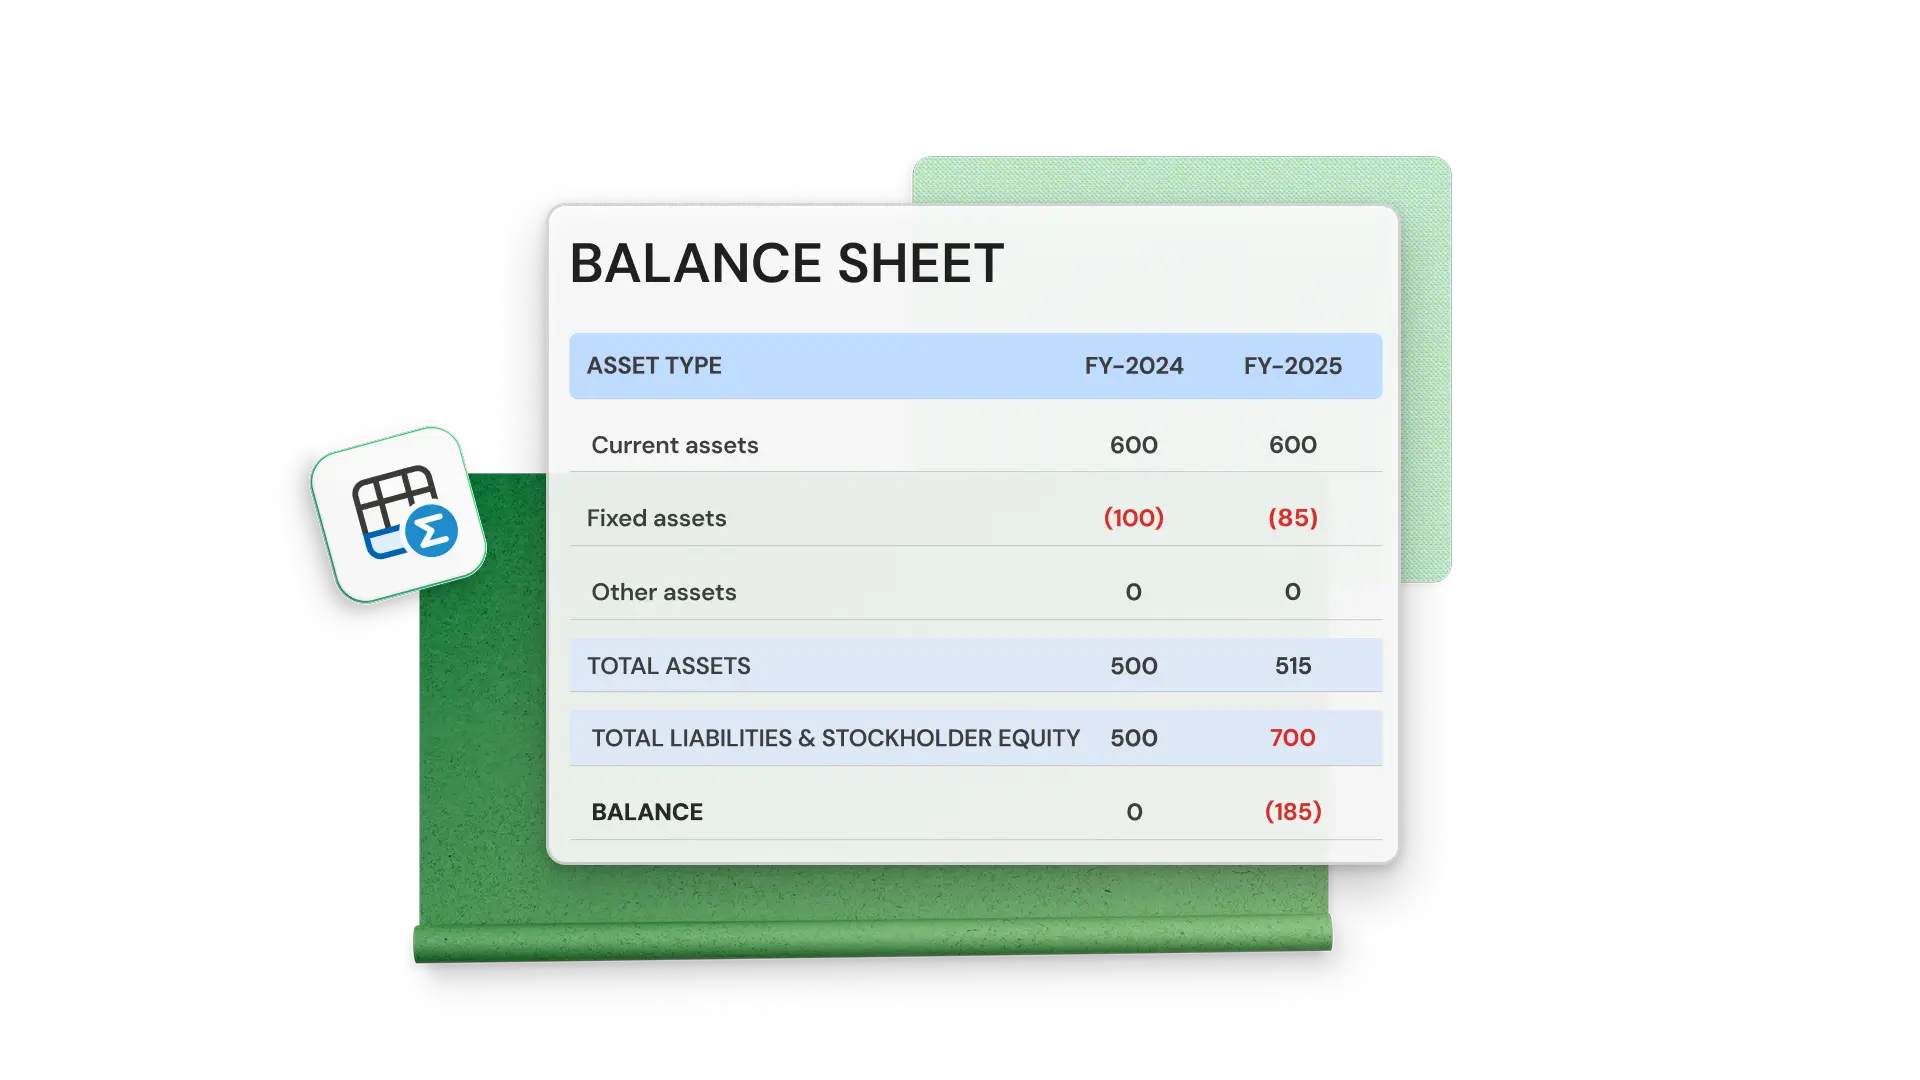
A balance sheet is a financial statement that presents a company’s assets, liabilities, and shareholders’ equity on a specific reporting date. It reflects the financial position at a point in time, rather than operating results over a period. The income statement answers how much the company earned during a period, the cash flow statement answers how cash flowed in and out, and the balance sheet answers what the company owns, what it owes, and how much net assets belong to shareholders.
The basic logic of the balance sheet comes from the accounting equation: assets = liabilities + shareholders’ equity. Assets represent economic resources controlled by the company, liabilities represent present obligations the company needs to fulfill, and shareholders’ equity represents the residual interest attributable to owners after liabilities are deducted from assets. This equation also shows that the funding sources of a company’s assets usually come from two channels: funds provided by creditors, and equity formed from shareholder investment and retained earnings from operations.
In fundamental analysis, the balance sheet is used to observe a company’s liquidity, solvency, capital structure, asset quality, and financial leverage. It cannot independently determine a company’s future performance, but it can help analysts identify whether the company relies too heavily on debt, has sufficient cash, faces inventory buildup, collection pressure on accounts receivable, or a continued decline in shareholders’ equity.
Core Structure of the Balance Sheet
Assets: economic resources owned or controlled by the company, including cash, accounts receivable, inventory, financial assets, fixed assets, and intangible assets.
Liabilities: obligations the company needs to fulfill to external creditors, suppliers, employees, tax authorities, or other parties.
Shareholders’ equity: the residual interest after liabilities are deducted from assets, including share capital, capital reserve, retained earnings, and treasury shares.
Reporting date: the balance sheet reflects the position on a specific date, such as quarter-end, half-year-end, or year-end.
How Asset Items Reflect the Quality of Company Resources
Assets refer to resources controlled by a company that are expected to bring economic benefits. Assets should not be assessed only by their amount; analysts also need to observe liquidity, convertibility into cash, usage efficiency, and impairment risk. Cash is usually of higher quality, while inventory and accounts receivable require further checks on turnover speed and collectability. Fixed assets and intangible assets also require consideration of depreciation, amortization, and impairment.
Main Items of Current Assets
Cash and cash equivalents: highly liquid items, usually including bank deposits, cash on hand, and investment instruments with short maturities, low risk, and easy conversion into fixed amounts of cash.
Marketable securities: usually stocks, bonds, or other financial instruments that can be traded in active markets, with values that may change according to market prices.
Accounts receivable: amounts owed to the company by customers for products or services already purchased, which should be analyzed together with allowance for doubtful accounts, aging structure, and customer concentration.
Inventory: goods, raw materials, and work-in-progress prepared by the company for sales, production, or operations, usually requiring attention to cost measurement, inventory write-down provisions, and turnover speed.
The key focus of current asset analysis is “whether they can be converted into cash within a relatively short cycle.” For example, cash can be directly used for debt repayment and operations; accounts receivable can only become cash after customers pay; inventory can generate cash flow only after sales and collection are completed. If a company’s revenue grows quickly, but accounts receivable and inventory grow faster than revenue for a long period, it may indicate rising collection pressure or inventory pressure.
Main Items of Non-Current Assets
Long-term securities: financial assets that the company plans to hold for the long term or that are not easily converted into cash in the short term.
Fixed assets: including land, buildings, machinery and equipment, production lines, and transportation equipment, used for long-term operating activities.
Intangible assets: assets without physical form, including patents, trademarks, copyrights, software, customer relationships, and goodwill.
Long-term investments: investments in associates, joint ventures, or other long-term equity projects.
The key focus of non-current asset analysis is “whether they can continue generating economic benefits.” Companies with high fixed assets usually have greater capital expenditure needs, such as manufacturing, utilities, and energy companies. Companies with high intangible assets require checks on how those assets were formed, especially whether goodwill generated by acquisitions carries impairment risk. Asset structures vary significantly across different business models, so balance sheet analysis must include peer comparison.
How Liability Items Reflect Debt Repayment Pressure
Liabilities are obligations formed by past transactions or events that the company is expected to fulfill by paying cash, delivering assets, or providing services. Liabilities are not necessarily negative by themselves. Moderate debt can support business expansion and capital expenditure, but excessive debt increases interest burden, refinancing pressure, and financial risk.
Common Liability Items
Accounts payable: amounts the company owes to suppliers, usually related to procurement, production, and inventory scale.
Short-term borrowings: bank loans or other borrowings that usually need to be repaid within one year.
Long-term debt: loans, bonds, or other financing obligations with repayment periods typically longer than one year.
Taxes payable: taxes that have already been incurred by the company but have not yet been paid.
Pension obligations: long-term payment responsibilities the company bears for employee retirement benefits, with specific presentation depending on accounting standards and plan type.
Lease liabilities: payment obligations arising from the company’s leases of office space, stores, equipment, or other assets.
Liability analysis needs to distinguish between short-term pressure and long-term structure. High short-term liabilities combined with insufficient cash may affect daily operations and debt repayment arrangements. High long-term debt may expose the company to greater pressure when interest rates rise, cash flow declines, or refinancing conditions tighten. Analysts should simultaneously review debt maturity structure, interest rate type, collateral arrangements, and operating cash flow coverage capacity.
Basic Process for Solvency Analysis
First distinguish current liabilities from non-current liabilities and confirm the amount that needs to be repaid within the next 12 months.
Compare cash, short-term investments, and operating cash flow to determine whether sources for short-term debt repayment are sufficient.
Check the maturity distribution of long-term debt and identify whether there is concentrated maturity risk.
Observe the relationship between interest expenses and operating profit to determine whether earnings can cover financing costs.
Combine the industry cycle and interest rate environment to assess whether the debt structure remains affordable under stress scenarios.
What Does Shareholders’ Equity Indicate?
Shareholders’ equity refers to the residual interest attributable to shareholders after liabilities are deducted from company assets. It usually includes share capital, capital reserve, retained earnings, other comprehensive income, and treasury shares. Changes in shareholders’ equity can reflect retained profits, capital injections, dividends, share repurchases, and accounting adjustments.
Main Items of Shareholders’ Equity
Share capital: the legal capital item formed by the company’s issuance of shares to shareholders. The specific name and presentation may vary depending on the listing venue and accounting standards.
Capital reserve: usually includes equity items formed when the share issuance price exceeds par value, and may also include the effects of other capital transactions.
Retained earnings: the portion of accumulated profits retained in the company after dividends are deducted, which may be used for reinvestment, debt repayment, share repurchases, or other operating purposes.
Treasury shares: the company’s own shares repurchased and held by the company, usually presented as a deduction from shareholders’ equity and not counted as ordinary outstanding shares.
Other comprehensive income: certain gains or losses not yet included in current profit or loss, such as fair value changes in some financial assets or foreign currency translation differences.
Positive and continuously growing retained earnings usually indicate that part of the company’s past profits has been retained within the business. However, this does not automatically mean capital is being used efficiently. Analysts still need to check whether retained earnings have translated into higher revenue, profit, cash flow, or return on capital. Treasury shares should be analyzed together with share repurchase policy. A company’s repurchase of shares may reduce the number of outstanding shares, but if repurchases are made at excessive prices or financed with high debt, balance sheet quality may weaken.
How to Use the Balance Sheet to Identify Financial Structure
Balance sheet interpretation should not rely only on a single-period figure. A more effective method is to compare the current statement with statements from the past 3 to 5 years, while also conducting cross-sectional comparison with companies in the same industry. Vertical comparison can reveal trends, while horizontal comparison can identify whether the company deviates from industry norms.
| Item Name | Key Parameters | Applicable Scenario | Main Risk |
|---|---|---|---|
| Cash and Cash Equivalents | Cash as a percentage of total assets, cash coverage multiple of short-term debt; observation period is usually quarterly or annual | Assessing short-term liquidity and funding buffer capacity | High cash does not necessarily mean good operating quality; it may come from borrowings, asset sales, or financing funds not yet invested |
| Accounts Receivable and Inventory | Days sales outstanding, inventory turnover days, allowance for doubtful accounts, and inventory write-down provisions | Analyzing sales collection quality, inventory pressure, and working capital usage | Slower collections or inventory buildup may provide early indications of declining demand and margin pressure |
| Long-Term Debt | Debt maturity profile, ratio of fixed-rate to floating-rate debt, interest coverage ratio | Assessing long-term financing pressure and interest rate sensitivity | High debt may amplify solvency risk when interest rates rise or cash flow declines |
| Shareholders’ Equity | Retained earnings, treasury shares, return on equity, rate of change in equity | Observing historical retained earnings, share repurchase impact, and capital structure changes | Declining equity may come from losses, share repurchases, dividends, or accounting adjustments, and the cause needs to be broken down |
Common Steps in Balance Sheet Analysis
Confirm the reporting date and accounting standards to avoid directly comparing data from different periods or under different standards.
Observe the direction of changes in total assets, total liabilities, and shareholders’ equity to determine whether company size and funding sources are changing in sync.
Break down current assets and current liabilities to determine whether short-term liquidity is sufficient.
Check long-term assets and long-term debt to judge whether expansion depends on relatively high capital expenditure or external financing.
Compare with companies in the same industry to identify whether the company’s asset structure, debt level, and equity structure significantly deviate from industry levels.
Combine the income statement and cash flow statement to verify whether balance sheet changes correspond to real operating results.
How the Debt-to-Equity Ratio Measures Financial Leverage
The debt-to-equity ratio is a common indicator used to measure a company’s financial leverage. Its basic calculation is: debt-to-equity ratio = total liabilities ÷ shareholders’ equity. If a company has total liabilities of RMB 60 billion and shareholders’ equity of RMB 40 billion, the debt-to-equity ratio is 1.5 times, or 150%.
The higher this ratio is, the more the company typically relies on debt financing. Higher leverage may improve capital efficiency, but it also increases interest expenses, debt repayment pressure, and refinancing risk. Lower leverage usually indicates a more conservative balance sheet, but if a company holds a large amount of low-yielding assets for a long period, it may also indicate insufficient capital efficiency.
What to Note When Interpreting the Debt-to-Equity Ratio
Industry differences: banks, utilities, real estate, and manufacturing companies have different common leverage levels and should not be directly compared across industries.
Nature of debt: interest-bearing debt, operating payables, and lease liabilities have different risk implications and need to be analyzed separately.
Profitability: among highly leveraged companies, those with stable cash flow may have lower risk than those with more volatile revenue.
Interest rate environment: companies with a high proportion of floating-rate debt are more sensitive to rising interest rates.
Equity quality: if shareholders’ equity is affected by large goodwill, accumulated losses, or treasury shares, the debt-to-equity ratio may be amplified.
The debt-to-equity ratio cannot independently judge whether a company is good or bad. It is more suitable for use together with interest coverage ratio, operating cash flow, debt maturity structure, and industry averages. For cyclical industries, analysts also need to recalculate solvency under stress scenarios involving revenue decline, margin compression, and rising financing costs.
Applicable Conditions and Limitations of Balance Sheet Analysis
The balance sheet is suitable for analyzing a company’s financial structure at a specific point in time, but it also has limitations. Some asset values depend on accounting estimates, certain liabilities may be disclosed in notes, and the balance sheet itself cannot fully show a company’s brand value, customer relationships, management capability, or quality of future orders.
Applicable condition: the analysis target has standardized financial disclosures, and asset, liability, and equity items can be compared continuously.
Applicable condition: the analyst needs to assess liquidity, capital structure, debt pressure, and asset quality.
Limitation 1: the balance sheet is point-in-time data and cannot directly show revenue and cash flow changes over the entire period.
Limitation 2: some assets require valuation assumptions, such as goodwill, intangible assets, financial assets, and inventory write-down provisions.
Limitation 3: different accounting standards, industry practices, and company disclosure methods may affect comparability.
Limitation 4: a strong balance sheet does not mean the company will necessarily grow in the future; it still needs to be analyzed together with the income statement, cash flow statement, and industry environment.
The core value of the balance sheet is to help analysts understand whether a company’s financial structure is sound. The asset side explains resource quality, the liability side explains debt repayment pressure, and the equity side explains capital sources and historical accumulation. Only by combining this information with ratio analysis, peer comparison, and long-term trends can financial risks and operating characteristics within company fundamentals be identified more accurately.
Questions Related to the Balance Sheet
What Is the Difference Between a Balance Sheet and an Income Statement?
A balance sheet reflects a company’s assets, liabilities, and shareholders’ equity on a specific date and is a point-in-time statement. An income statement reflects a company’s revenue, costs, expenses, and profit over a certain period and is a period statement. The two need to be read together.
Why Must Assets Equal Liabilities Plus Shareholders’ Equity?
Because the funding sources of a company’s assets can be divided into funds provided by creditors and funds provided or retained by shareholders. Liabilities represent creditors’ claims, while shareholders’ equity represents owners’ equity, so total assets must equal the sum of liabilities and shareholders’ equity.
Is an Increase in Accounts Receivable Always a Negative Signal?
Not necessarily. An increase in accounts receivable may come from sales growth, or it may come from slower collection. It needs to be judged together with revenue growth, aging structure, allowance for doubtful accounts, and customer concentration. If accounts receivable grow faster than revenue for a long period, collection quality requires close attention.
Why Do Treasury Shares Reduce Shareholders’ Equity?
Treasury shares are usually the company’s own shares repurchased and held by the company. Since the company pays cash to repurchase shares, treasury shares are usually presented as a deduction from shareholders’ equity, thereby reducing book shareholders’ equity.
Is a Lower Debt-to-Equity Ratio Always Better?
Not necessarily. A lower debt-to-equity ratio usually indicates lower leverage, but it may also indicate insufficient capital efficiency. This indicator needs to be analyzed together with industry characteristics, cash flow stability, interest rate environment, debt maturity, and profitability.


