Learn how a balance sheet presents assets, liabilities and shareholders’ equity, how it differs from other financial statements, and how liquidity, leverage and equity ratios help assess a company’s financial health.
The Balance Sheet: A Core Statement for Understanding a Company’s Financial Position
In corporate financial analysis, the balance sheet is one of the most important financial statements. It provides a systematic overview of a company’s assets, liabilities and shareholders’ equity at a specific point in time, making it highly valuable to investors, management teams and financial institutions. Understanding its structure and how to interpret it is fundamental to assessing a company’s financial health.
What Is a Balance Sheet? Understanding the Basic Accounting Equation
A balance sheet forms part of a company’s financial statements and presents its financial position at a particular point in time. It allows readers to see clearly the company’s resource structure, debt obligations and the equity attributable to its owners. Put simply, it answers a central question: at a given moment, what does the company own, what does it owe and how much do its shareholders actually own?
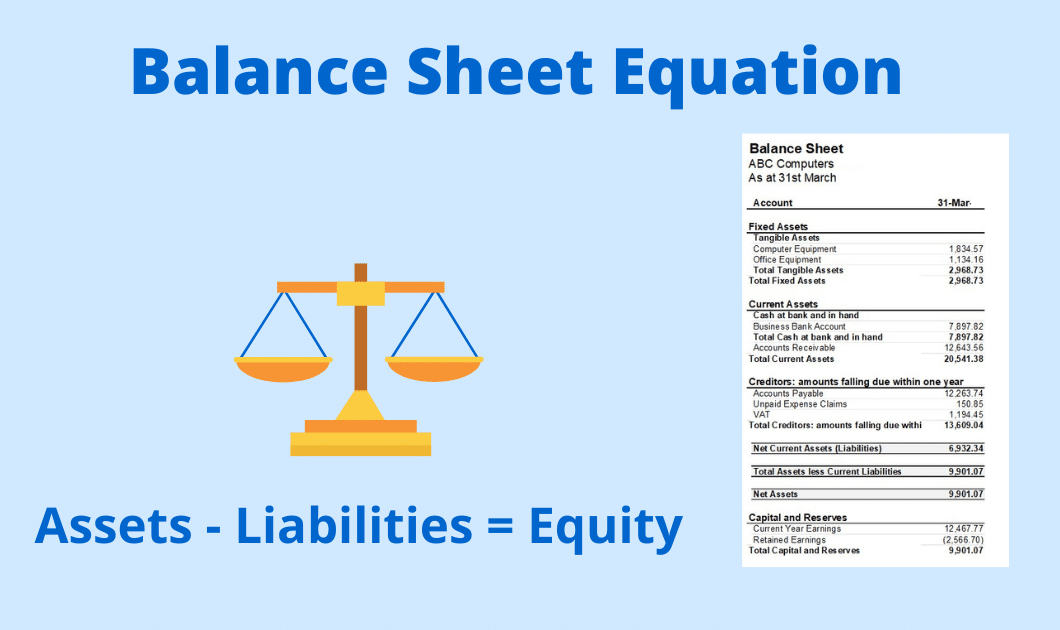
The balance sheet is based on a fundamental accounting equation, which can be expressed as follows:
Assets = Liabilities + Shareholders’ Equity
This equation reveals the two principal sources of a company’s assets. One portion is financed through obligations undertaken by the company, namely liabilities, while the other comes from shareholders’ investment, namely shareholders’ equity. This relationship enables management, investors and financial analysts to gain a comprehensive view of the company’s financial position.
What Does a Balance Sheet Contain? The Three Main Components Explained
A balance sheet is primarily composed of assets, liabilities and shareholders’ equity. Each component can be further divided according to liquidity or repayment period, and understanding these classifications is essential to interpreting the statement.
Assets: Economic Resources Owned by the Company
Assets represent all the economic resources controlled by a company and are generally divided into two categories according to how quickly they can be converted into cash or used:
Current assets: Assets that can generally be converted into cash or used within one year, including cash, trade receivables and inventories.
Non-current assets: Assets held for the long term and used in business operations, including long-term investments and fixed assets such as machinery, equipment and buildings.
Liabilities: Obligations the Company Must Repay
Liabilities are financial obligations that a company must repay to external parties. They are also divided into two categories according to their repayment periods:
Current liabilities: Obligations that are generally due for repayment within one year, including short-term borrowings and trade payables.
Non-current liabilities: Obligations with repayment periods exceeding one year, primarily including long-term borrowings.
Shareholders’ Equity: Net Assets Attributable to Shareholders
Shareholders’ equity represents the company’s net assets attributable to shareholders after all liabilities have been deducted. It mainly includes share capital, capital reserves and retained earnings, and is an important indicator of the company’s ability to achieve stable long-term development.
How Do the Three Main Financial Statements Differ? A Conceptual Comparison
The balance sheet does not exist in isolation. Together with the income statement and cash flow statement, it forms a complete financial reporting system. As each statement presents a different perspective, their roles can easily be confused. The table below compares their core concepts and helps readers understand their respective functions.
| Comparison Item | Balance Sheet | Income Statement | Cash Flow Statement |
|---|---|---|---|
| Information Presented | Financial position | Operating performance | Cash movements |
| Time Dimension | A specific point in time | A particular reporting period | A particular reporting period |
| Core Question | What the company owns and owes | How much the company earned | Where cash came from and where it went |
| Key Components | Assets, liabilities and equity | Revenue, costs and profit | Operating, investing and financing activities |
As the table shows, the balance sheet provides a snapshot at a particular point in time, whereas the income statement and cash flow statement reflect activity over a reporting period. Only by considering all three together can readers develop a complete understanding of a company’s financial position.
How Do You Interpret a Balance Sheet? Key Financial Ratios Explained
Interpreting a balance sheet involves examining assets, liabilities and shareholders’ equity and calculating key ratios to assess a company’s solvency and financial structure. The following three ratios are among the most commonly used.
Current Ratio: Measuring Short-Term Solvency
The current ratio measures a company’s ability to meet its short-term obligations and is calculated as follows:
Current Ratio = Current Assets ÷ Current Liabilities
A ratio above 1 generally indicates that the company has sufficient current assets to cover its short-term liabilities. For example, if a company has current assets of RMB10 million and current liabilities of RMB5 million, its current ratio is 2. This means that every RMB1 of short-term liabilities is supported by RMB2 of current assets, indicating relatively sound short-term solvency.
Debt-to-Assets Ratio: Measuring Debt Risk
The debt-to-assets ratio measures the proportion of total assets financed by liabilities and is calculated as follows:
Debt-to-Assets Ratio = Total Liabilities ÷ Total Assets
A higher ratio indicates that the company carries greater debt risk, while a lower ratio suggests that it relies more heavily on shareholders’ capital and may have a more stable financial position. For example, if a company has total assets of RMB50 million and total liabilities of RMB30 million, its debt-to-assets ratio is 0.6. This means that 60% of its assets are financed through debt, indicating a relatively substantial debt burden.
Shareholders’ Equity Ratio: Measuring Capital Stability
The shareholders’ equity ratio measures the proportion of total assets financed by shareholders’ equity and reflects the stability of the company’s capital structure. It is calculated as follows:
Shareholders’ Equity Ratio = Shareholders’ Equity ÷ Total Assets
A higher ratio generally indicates a stronger financial position and greater resilience to risk. For example, if a company has shareholders’ equity of RMB20 million and total assets of RMB50 million, its shareholders’ equity ratio is 0.4. This means that 40% of its assets are funded by shareholders, indicating a relatively sound capital base.
How Can a Company Be Analysed Comprehensively? Company A as an Example
By considering the three ratios above together, an analyst can form a broader assessment of a company’s financial position. Suppose Company A has a current ratio of 2, a debt-to-assets ratio of 0.6 and a shareholders’ equity ratio of 0.4. The following conclusions can be drawn from three perspectives:
Short-term solvency: A current ratio of 2 indicates that Company A has sufficient current assets to cover its short-term liabilities and therefore has relatively strong short-term solvency.
Debt risk: A debt-to-assets ratio of 0.6 means that the company relies substantially on debt financing. Its relatively high proportion of liabilities may create a degree of financial risk.
Capital structure: A shareholders’ equity ratio of 0.4 indicates that 40% of the company’s assets are funded by shareholders. Its capital structure is relatively stable, although caution would still be required before taking on additional debt financing.
It is important to emphasise that no single ratio can provide a complete picture. Multiple indicators should be assessed together and interpreted in the context of the company’s industry. Manufacturing companies, for example, often have higher debt-to-assets ratios because they hold substantial fixed assets, while service companies generally have lower ratios. Examining a figure in isolation without considering industry characteristics can therefore lead to incorrect conclusions.
What Role Does the Balance Sheet Play in Practice?
The balance sheet is not merely a tool for presenting a company’s financial position. It also plays a critical role in financial analysis and business decision-making. Its principal functions include:
A foundation for financial analysis: It provides core data for assessing a company’s financial health. When considered alongside the income statement and cash flow statement, it enables analysts to understand the company’s operating performance, cash movements and financial structure comprehensively.
A basis for financing decisions: When providing loans or other forms of finance, financial institutions generally examine the balance sheet closely to assess the borrower’s solvency, liquidity and future funding requirements.
Risk assessment and investment analysis: Investors can use the balance sheet to evaluate a company’s growth potential and possible risks. An excessively high debt ratio or a relatively low shareholders’ equity ratio often indicates greater financial risk.
How Can Imbalanced Financial Indicators Signal Risk? A Real-World Example
Changes in the ratios presented by a balance sheet can often provide early warning signs of financial distress. The case of Chinese property developer Jinke Property Group, listed under stock code 000656, offers a specific example.
Background: Jinke Property Group was established in 1998 and is a property development company listed on the Shenzhen Stock Exchange. Against a backdrop of highly leveraged expansion within the property sector, the company accumulated substantial debt pressure within its financial structure.
Development: According to disclosures from market institutions, analysis of the company’s financial data had already identified several abnormal indicators by the end of 2023. Its current ratio and quick ratio were both relatively low, and declines in these ratios are generally strongly associated with corporate bankruptcy, financial distress and debt defaults. At the same time, its interest coverage ratio was negative, indicating that operating profit was no longer sufficient to cover interest expenses.(Source: Financial data analysis of listed companies, date: December 2023)
Industry impact: The case of Jinke Property Group was not an isolated incident, but reflected the debt risks affecting the property industry during a particular period. It clearly demonstrates that a sustained deterioration in balance-sheet solvency ratios may signal a deeper operational crisis. This has also encouraged investors and creditors to place greater emphasis on the ongoing monitoring of indicators such as the current ratio and debt-to-assets ratio.
This example demonstrates that financial ratios are not merely static calculations, but important tools for observing trends in a company’s financial health. Regularly monitoring changes in these indicators can help stakeholders identify risks at an earlier stage and take appropriate action.
Frequently Asked Questions About Balance Sheets
What is the basic accounting equation of a balance sheet?
The basic balance-sheet equation is “Assets = Liabilities + Shareholders’ Equity”. It shows that all of a company’s assets originate from two sources: obligations owed to external parties, which are recorded as liabilities, and capital invested by shareholders, which is recorded as shareholders’ equity. The sum of the two must always equal total assets.
What is the difference between current and non-current assets?
The principal difference is the period over which the assets are expected to be converted into cash or used. Current assets can generally be converted into cash or consumed within one year and include cash, trade receivables and inventories. Non-current assets are held for the long term and used in business operations, including long-term investments and fixed assets such as machinery, equipment and buildings.
What does a current ratio above 1 mean?
The current ratio is calculated by dividing current assets by current liabilities. When the ratio is above 1, it generally means that the company has sufficient current assets to cover its short-term obligations, indicating relatively sound short-term solvency. A higher ratio usually provides a larger repayment buffer, although an excessively high figure may also suggest inefficient use of capital.
Is a lower debt-to-assets ratio always better?
Not necessarily. A lower debt-to-assets ratio indicates less debt risk and a more stable financial position, but it may also suggest that the company is not using debt financing effectively and could have lower capital efficiency. An appropriate ratio should be assessed in relation to the company’s industry, as manufacturing businesses generally have higher ratios than service businesses.
What is the difference between a balance sheet and an income statement?
The two statements differ in their time dimensions. A balance sheet presents a company’s financial position at a specific point in time and therefore acts as a snapshot. An income statement presents the company’s revenue, costs and profit over a particular reporting period and therefore reflects a process. Considering both statements together provides a more complete assessment of the company’s operating and financial performance.





