Understand how commodity prices are shaped by supply and demand, inventories, the U.S. dollar, interest rates, derivatives, leverage, and risk premiums across major markets.
The Underlying Logic Behind Commodity Price Fluctuations
Commodities are basic inputs for the operation of the global economy, known in English asCommodity. Energy is used in transportation, power generation, and industrial production; metals are used in manufacturing, infrastructure, and electronic devices; agricultural products are closely related to food supply and household consumption. Therefore, commodity prices reflect not only financial trading activity, but also real-world changes in production, transportation, inventories, and consumption.
Unlike stocks, commodities do not have corporate income statements, nor do they automatically generate cash flow through improved management efficiency. Their prices are more determined by the dynamic balance among supply curves, demand curves, inventory buffers, financial capital, and risk premiums. Short-term prices can be affected by speculative capital, but long-term prices still need to be understood within the framework of supply, demand, and costs.
The American economist John Maynard Keynes discussed hedging pressure and futures prices in commodity markets in his 1930 workA Treatise on Money. Later, John Hicks further developed related ideas in his 1939 workValue and Capital. The price discovery function of modern commodity futures markets is also connected to these early theories.
Spot Prices and Futures Prices Are Not the Same Concept
Spot prices reflect the price of commodities for current delivery or near-term delivery. Futures prices reflect the market’s expectation of the delivery or settlement price for a specific future month. The two are usually related, but they are not exactly the same. Transportation costs, storage costs, interest rates, insurance costs, seasonal supply, and inventory levels can all create spreads between spot and futures prices.
| Comparison Dimension | Key Parameters | Applicable Scenario | Main Risks |
|---|---|---|---|
| Spot Price | Current supply and demand, immediate delivery, regional price spreads | Physical trade, refinery procurement, ore and agricultural product trading | Transportation disruptions, insufficient storage, quality differences |
| Futures Price | Expiration month, contract size, margin, rollover | Hedging, price discovery, risk management | Margin calls, expiration rules, spread volatility |
| ETF Price | Net asset value, holding structure, expense ratio, tracking error | Indirectly observing commodities or commodity-related assets | Tracking deviation, rollover costs, holding concentration |
| CFD Quotes | Bid-ask spread, leverage, overnight fees, liquidation level | Observing price fluctuations and simulating margin trading mechanisms | Leverage magnifies losses, platform quote differences |
Why Supply and Demand Are the Core Variables
Supply and demand determine the medium- to long-term direction of commodity prices. When supply declines while demand remains stable, prices usually face upward pressure. When supply is sufficient while demand falls, prices usually face downward pressure. Energy commodities, industrial metals, and agricultural products all follow this basic framework, although their specific transmission paths differ.
Taking crude oil as an example, the supply side is affected by oil-producing countries’ policies, drilling activity, pipeline transportation, refinery maintenance, and geopolitics; the demand side is affected by transportation, air travel, industrial production, and seasonal consumption. Taking copper as an example, the supply side is affected by mine output, smelting capacity, and port inventories, while the demand side is related to power grid construction, real estate, manufacturing, and new energy equipment.
Inventories Are the Buffer Between Supply and Demand
Inventories can be understood as a buffer between supply and demand shocks. When inventories are high, the market’s sensitivity to short-term supply disruptions may decline. When inventories are low, even a small supply disturbance may trigger rapid price volatility. Commercial crude oil inventories, strategic reserves, Cushing inventories, and refined product inventories are all commonly watched data points for traders in the crude oil market.
Rising inventories usually indicate that supply exceeds demand, or that downstream consumption is weaker than expected.
Falling inventories usually indicate stronger demand or constrained supply.
When inventory levels are low, the market is more likely to react sensitively to geopolitical conflicts and weather events.
Inventory data should be analyzed together with seasonality and refinery utilization rates, rather than relying only on weekly changes.
Why the U.S. Dollar Pricing Effect Matters
Most international commodities are priced in U.S. dollars, so exchange rate movements change the actual purchasing costs for non-dollar buyers. When the U.S. dollar strengthens, buyers using the euro, yen, renminbi, or other currencies need to pay more in their local currency to buy the same amount of commodities, which may suppress demand. When the U.S. dollar weakens, the purchasing power of non-dollar buyers improves, which may support commodity demand.
However, the relationship between the U.S. dollar and commodity prices is not a mechanical negative correlation. When global energy supply is tight, financial market risk aversion rises, or the United States itself benefits from energy exports, the dollar and some commodity prices may strengthen at the same time. Traders who judge commodity direction only based on the U.S. Dollar Index may easily overlook inventories, transportation, policy, and geopolitical risks.
How Interest Rates Affect Commodity Prices
Interest rates affect commodity markets through funding costs and holding costs. For assets such as gold that do not generate interest, rising real interest rates usually increase the attractiveness of holding cash or bonds, thereby weakening gold’s relative appeal. For industrial commodities, rising interest rates may reduce corporate investment and household consumption, indirectly weakening demand.
Real interest rates can be simplified as: real interest rate = nominal interest rate - inflation rate. When nominal interest rates rise and inflation expectations decline, real interest rates may move higher. When inflation rises faster than nominal interest rates, real interest rates may fall. This framework is often used to analyze gold, but it also needs to be combined with the U.S. dollar, central bank gold purchases, ETF fund flows, and safe-haven demand.
Why Different Commodities Cannot Be Analyzed with the Same Indicators
There are major differences within the commodity market. Crude oil emphasizes inventories, production, and transportation; gold emphasizes real interest rates and safe-haven demand; copper emphasizes manufacturing momentum and infrastructure demand; agricultural products emphasize weather and planting cycles. Using the same set of indicators to analyze all commodities can easily lead to incorrect judgments.
| Commodity Category | Key Parameters | Applicable Scenario | Main Risks |
|---|---|---|---|
| Crude Oil and Natural Gas | Inventories, production, refinery utilization rates, transportation bottlenecks | Observing energy supply, industrial activity, and geopolitical risk | Policy intervention, sudden conflicts, sharp changes in inventory data |
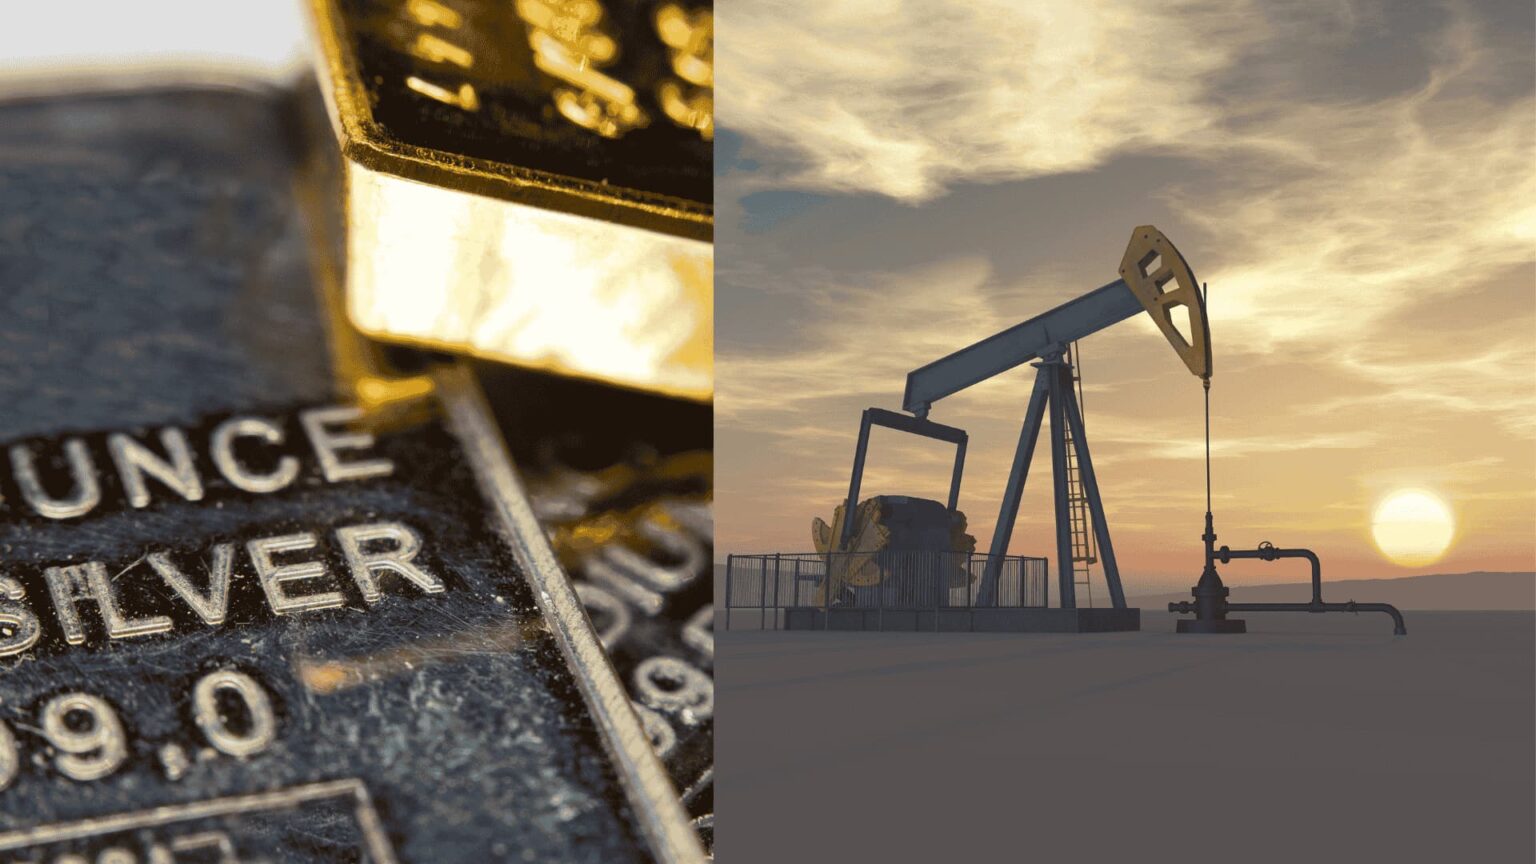
| Gold and Silver | Real interest rates, U.S. Dollar Index, ETF holdings, central bank demand | Observing safe-haven demand and changes in the monetary environment | Rising interest rates, stronger U.S. dollar, declining investment demand |
| Copper and Aluminum | PMI, inventories, mine output, infrastructure demand | Observing the manufacturing cycle and demand from new energy construction | Economic slowdown, supply recovery, inventory increases |
| Agricultural Products | Weather, planted area, yield, export policies | Observing food supply chains and seasonal output changes | Climate anomalies, trade restrictions, harvest estimate deviations |
How Derivatives Change Commodity Trading Methods
Futures, options, and contracts for difference have expanded participation in commodity markets. Futures contracts can help producers lock in selling prices and help consuming companies lock in procurement costs. Contracts for difference, orCFDs, are settled based on price differences and do not require traders to actually hold or deliver the commodity.
The convenience of CFDs comes from the margin mechanism, but the risk also comes from the margin mechanism. Margin is not a cost ceiling, but a deposit required to maintain a notional position. If the market price moves in an unfavorable direction, losses are calculated based on the notional position, not only on the margin amount. Therefore, the higher the leverage, the more obvious the impact of small price movements on account equity.
Leverage Calculations Need to Avoid Order-of-Magnitude Errors
The basic formula for leverage is: notional position = margin × leverage ratio. For example, USD 100 of margin under 100:1 leverage corresponds to a notional position of USD 10,000, not USD 100,000. To establish a notional position of USD 100,000 under 100:1 leverage, USD 1,000 of margin is required. This calculation relationship is the foundation for understanding margin risk.
First, confirm account equity, such as USD 5,000 or USD 10,000.
Then, confirm the risk ratio per trade, such as 1% to 2% of account equity.
Estimate a reasonable stop-loss distance based on the volatility of the instrument.
Calculate position size backward based on the stop-loss distance and value per point.
Finally, check margin usage and remaining available margin.
The Relationship Between Price Discovery and Speculative Capital
Speculative capital is not the same as price manipulation. Speculators in futures markets provide liquidity, hedgers transfer risk, and arbitrageurs repair price differences between different markets. The issue is that when market sentiment becomes overly concentrated, speculative capital may amplify short-term volatility, especially when inventories are low, liquidity declines, or news is released intensively.
Traders need to distinguish between two questions: first, whether commodity fundamentals have changed; second, whether prices have already reflected that change in advance. The former requires tracking production, inventories, consumption, and policy; the latter requires observing positions, trading volume, term structure, and market expectations.
If fundamentals improve but prices have already fully reflected it, continuing to follow the move may involve pullback risk.
If prices fall but inventories remain tight, it is necessary to judge whether this is only a short-term capital adjustment.
If far-month prices are higher than near-month prices, this may reflect storage costs, demand expectations, or changes in market structure.
If near-month prices are higher than far-month prices, this may reflect short-term supply tightness or rising delivery demand.
Frequently Asked Questions About Commodity Pricing Mechanisms
What mainly determines commodity prices?
Commodity prices are mainly determined by supply and demand, inventory levels, production costs, the U.S. dollar exchange rate, interest rates, policy changes, and unexpected events. The core variables differ across commodity categories.
Why does inventory data affect crude oil prices?
Inventories reflect the balance between short-term supply and demand. Falling inventories may indicate that demand is stronger than supply, while rising inventories may indicate sufficient supply or weaker demand. However, the judgment needs to be made together with seasonality and refinery utilization rates.
Does a stronger U.S. dollar always cause commodity prices to fall?
Not necessarily. A stronger U.S. dollar usually increases procurement costs for non-dollar buyers, but during an energy crisis, rising safe-haven demand, or extreme supply-demand imbalances, the dollar and some commodity prices may also strengthen at the same time.
Why does CFD leverage magnify risk?
CFD profit and loss are calculated based on the notional position, while margin is only the capital required to maintain the position. The higher the leverage, the greater the impact of the same price movement on account equity. Therefore, position size and margin usage must be strictly controlled.