Analyze the Fed’s June 2026 rate decision, Warsh’s first FOMC meeting, hawkish dot plot signals, and the impact on the dollar, gold, Treasuries, and U.S. stocks.
What Signal Did Warsh’s First Rate Meeting Send?
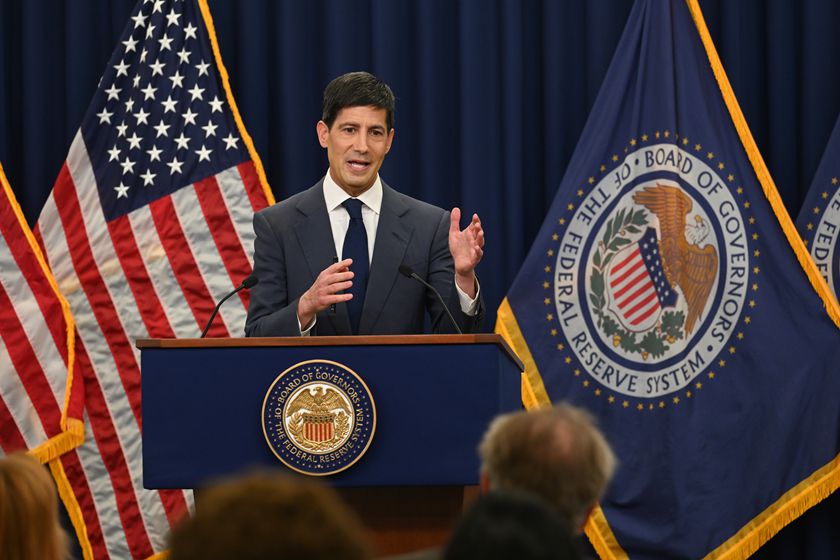
On June 17, 2026, the U.S. Federal Reserve concluded its two-day policy meeting and released its latest monetary policy decision. What made this meeting distinctive was that it was the first meeting chaired by newly appointed Chair Warsh. Kevin Warsh (born in 1970) previously served as Special Assistant to the President for Economic Policy and as Under Secretary of the Treasury for International Affairs during the George W. Bush administration. From 2006 to 2011, he served as a Federal Reserve Governor and was deeply involved in the design of unconventional monetary policy during the financial crisis. In early 2026, he succeeded former Chair Powell as Federal Reserve Chair, making his policy preferences and communication style a natural focus for the market.
In terms of the meeting outcome, all members of theFOMCvoted 12 to 0 to keep the target range for the federal funds rate unchanged at 3.50% to 3.75%. This marked the fourth consecutive meeting in which the Federal Reserve chose to stay on hold, broadly in line with market expectations. However, after the decision was released, core asset classes including the U.S. dollar, gold, U.S. Treasuries, and U.S. equities all showed clear reactions.
This seemingly contradictory phenomenon shows that financial markets never focus only on the rate decision itself, but also on how the Federal Reserve assesses the economic outlook and adjusts its guidance for the future policy path. As Paul Volcker, the Federal Reserve Chair historically known for fighting inflation, once said:
“Inflation is the ultimate threat to democratic institutions and economic freedom.”
Volcker’s judgment echoed through the hawkish signals released at this meeting. When inflation remains above the long-term 2% target, policymakers tend to maintain a higher-for-longer interest rate stance rather than move quickly toward easing. Understanding this is the prerequisite for interpreting the market reaction to this meeting.
Key Changes in the Policy Decision and Summary of Economic Projections
The main focus of this meeting was not the rate decision itself, but the Summary of Economic Projections and dot plot released at the same time. The dot plot reflects the median expectation of regional Federal Reserve presidents for the future interest rate path and serves as a core reference for markets in interpreting the direction of Fed policy. The updated projections showed notable adjustments across several dimensions.
The main changes were as follows:
Interest rate path revised sharply higher: the median forecast for the federal funds rate at the end of 2026 was raised to 3.8%, significantly above the 3.4% projection in March, implying that room for rate cuts during the year has been substantially compressed.
Core inflation forecast revised higher: the 2026 corePCEinflation forecast was raised from 2.5% to 2.7%, showing that inflation stickiness is stronger than previously judged, with services prices still acting as the main driver.
Economic growth expectations maintained: the forecast for 2026 realGDPgrowth remained in the 2.3% to 2.4% range, the 2027 forecast stayed at 2.3%, and the longer-run growth estimate was revised up from 1.8% to 2.0%, reflecting marginal optimism about the potential growth momentum of the U.S. economy.
Labor market remains stable: the median unemployment rate forecast for the end of 2026 remained unchanged at 4.4%, consistent with the Fed’s view that the labor market remains relatively resilient.
In terms of statement language, the Federal Reserve removed some wording that had been viewed as dovish, shifting the overall tone in a more hawkish direction. At the press conference, Warsh emphasized that the Federal Reserve’s dual mandate is to promote maximum employment and maintain price stability, and that the central bank needs to preserve policy credibility. The market generally interpreted this as a signal that, with inflation still above target, the Fed is inclined to maintain a higher-for-longer rate stance and adopt a more cautious approach toward future rate cuts.
(Source: Federal Reserve, FOMC Statement and Summary of Economic Projections, published: 2026-06-17)
Chain Reaction Across Four Asset Classes After the Decision
Within hours after the decision was released, major global asset classes showed a typical hawkish shock response. The transmission logic followed the classic asset pricing chain: U.S. Treasury yields rose, the dollar strengthened, gold came under pressure, and equity valuations contracted. The table below compares the performance of four asset classes before and after the decision:
| Asset Class | Position Before the Decision | Reaction After the Decision | Core Driving Logic |
|---|---|---|---|
| U.S. Dollar Index (DXY) | At a cyclical low | Strengthened quickly and broke above key resistance | Hawkish dot plot increased the yield-spread appeal of dollar assets |
| Spot gold | Around USD 4,331 per ounce | Rose briefly before coming under pressure and falling back | Rising yields increased the opportunity cost of non-yielding assets |
| 2-year U.S. Treasury | Around 4.05% | Yield jumped 16 basis points to 4.21% | Short-term rate expectations were repriced |
| Dow Jones Industrial Average | Near historical highs | Fell by about 500 points | Higher discount rates in valuation models weighed on stock prices |
This reaction pattern was highly consistent with market behavior after previous hawkish rate meetings. It should be emphasized that this chain reaction did not stem from a change in the rate decision itself, but from a repricing of the future policy path. After the decision was released, the chief economist of Century Advisors stated that the market reaction was mainly aimed at the dot plot, whose stance was far more hawkish than expected.
Why Policy Guidance Matters More Than the Rate Decision Itself
In modern central banking theory, policy guidance is regarded as a core component of the monetary policy toolkit. The rate decision reflects the current policy stance, while guidance shapes market expectations for future policy. For asset prices, the former is already known information, while the latter is the real marginal pricing variable.
This meeting provided a typical example. The decision to keep rates unchanged had been largely priced in by the market before the meeting; however, the hawkish turn shown in the dot plot significantly exceeded market expectations. This led to a noticeable steepening of the yield curve, with the 2-year U.S. Treasury yield jumping 16 basis points in a single day, reflecting a rapid compression of market expectations for future rate cuts.
Three Transmission Channels Through Which Guidance Affects Markets
Policy guidance affects asset prices through the following three main channels:
Discount rate channel: expectations for the future interest rate path directly enter discounted cash flow models for assets such as stocks and bonds, affecting their present value assessments. Long-duration assets are particularly sensitive to changes in discount rates.
Exchange rate channel: changes in interest rate spread expectations drive cross-border capital flows, thereby affecting the relative price of the U.S. dollar against other major currencies. The rapid strengthening of the dollar index after this meeting was a typical example of this channel.
Safe-haven channel: when policy uncertainty rises, demand for traditional safe-haven assets such as gold and the Japanese yen can undergo structural changes. However, gold came under pressure this time because the opportunity cost caused by rising yields outweighed support from safe-haven demand.
Understanding these three channels can help investors anticipate the potential reaction direction of various asset classes during future rate meetings or major data releases.
Historical Reference for the Fed Policy Cycle
Viewed over a longer time horizon, the impact of the Federal Reserve’s policy cycle on financial markets shows clear phase-based characteristics. Placing this meeting within a historical context helps clarify where the current cycle stands.
The current policy cycle began with the tightening process in March 2022. In about one year, the Federal Reserve rapidly raised the federal funds rate from near zero to a peak range of 5.25% to 5.50%, marking the most aggressive pace of rate hikes in decades. The Fed then began a rate-cutting cycle in the second half of 2024, gradually lowering rates to the current range of 3.50% to 3.75%. The hawkish signal released at this meeting means that the rate-cutting process may enter a longer pause period, and the possibility of further adjustment cannot be ruled out.
This meeting was significant for three reasons:
Policy continuity after leadership transition: Warsh leaned hawkish in his first meeting as chair, initially establishing the policy tone for his tenure and easing market concerns about potential policy uncertainty during the leadership transition.
Recalibration of the inflation target path: the upward revision to the core PCE forecast shows that the timeline for achieving the 2% inflation target has been pushed further back, and that the Fed’s understanding of inflation stickiness has become more pragmatic.
Rebalancing of the dual mandate: the statement emphasized the dual mandate, meaning that the relative weight between employment and inflation objectives is being recalibrated, and future policy may become more sensitive to employment data.
Based on historical experience, similar cycles of policy expectation adjustment often last for several quarters. During such periods, the central level of market volatility tends to be significantly higher than during policy-stability phases, and cross-asset correlations also change noticeably.
Macro Data Windows the Market Will Watch Next
The Federal Reserve statement made clear that future policy decisions will continue to depend on incoming economic data, especially inflation and labor market conditions. This means that the following types of data will become core triggers for market repricing:
Inflation data: the monthlyCPIand PCE price index are the most direct indicators for judging the progress of disinflation. Energy prices, housing rents, and core services prices are the key areas to watch.
Employment data: theNFPreport and unemployment rate released at the beginning of each month reflect the tightness of the labor market. Wage growth, as an intermediate variable in inflation transmission, is also closely watched.
Growth data: quarterly advance and revised GDP readings, together with monthly retail sales, ISM manufacturing, and ISM services indices, reflect the endogenous growth momentum of the U.S. economy.
Fed communication: the Fed Chair’s congressional testimony, speeches by regional Federal Reserve presidents, and meeting minutes provide incremental policy signals beyond rate decisions.
Around data release windows, market volatility usually rises significantly, and pending order traders in particular need to pay attention to slippage and gap risk. Professional traders generally recommend actively reviewing positions and pending orders two hours before key data releases to avoid being hit by abnormal execution prices caused by temporary thin liquidity.
Questions About the Fed’s June Decision
What was the core result of the Federal Reserve’s June 2026 decision?
At its policy meeting on June 17, 2026, the Federal Reserve voted unanimously, 12 to 0, to keep the target range for the federal funds rate unchanged at 3.50% to 3.75%. This was the fourth consecutive meeting in which it stayed on hold. The decision itself was in line with market expectations, but the Summary of Economic Projections and dot plot released alongside it sent a clearly hawkish signal. The median 2026 rate forecast was raised to 3.8%, and the core PCE inflation forecast was revised up from 2.5% to 2.7%.
Why did markets react strongly even though rates were left unchanged?
The core focus of the market is never the rate decision itself, but the Federal Reserve’s guidance on the future policy path. The hawkish turn shown in this meeting’s dot plot exceeded market expectations, prompting investors to reprice the room for future rate cuts. This was reflected in higher U.S. Treasury yields, a stronger dollar, pressure on gold, and shrinking U.S. equity valuations, a typical hawkish shock reaction pattern. The rate decision was known information, while policy guidance was the real marginal pricing variable.
What role does the dot plot play in the Summary of Economic Projections?
The dot plot reflects FOMC participants’ expectations for the federal funds rate at the end of future years, and its annual median is regarded as an important reference for the Federal Reserve’s overall expected rate path. Markets usually view changes in the dot plot median as a key signal for judging future policy direction. In this update, the 2026 median rose from 3.4% to 3.8%, which was widely interpreted by the market as a clear indication that the rate-cutting process would slow.
Why did Warsh’s first meeting as chair receive so much market attention?
Warsh took over as Federal Reserve Chair in early 2026, and the June policy meeting was the first meeting he chaired. Markets focused on the new chair’s policy preferences and communication style, and whether he would continue his predecessor’s dovish stance or show a clear shift. The hawkish signal from this meeting initially established a tighter policy tone for Warsh’s tenure, offering an important reference for medium- to long-term dollar asset pricing. Warsh’s Treasury background and experience as a governor during the financial crisis are also viewed as important clues for understanding his policy orientation.
How should ordinary investors assess their holdings after a hawkish decision?
A hawkish decision usually implies rising discount rates, which can put short-term pressure on growth stocks, long-duration bonds, gold, and other assets, while providing relative support for short-duration bonds, financial stocks, and U.S. dollar cash. Investors should make a comprehensive assessment based on their own risk tolerance, investment horizon, and portfolio structure, and avoid high-leverage operations around data release windows. It should be emphasized that this article is a macro information summary and does not constitute any specific investment advice.





