
Interactive Brokers reported a 28% rise in Q2 2026 net revenue as client margin loans climbed 67% to US$108.5 billion, while its net interest margin narrowed to 1.93% amid lower lending yields.
Interactive Brokers Q2 2026 Results: Margin Loans Surge 67% as Net Interest Margin Falls to 1.93%
Interactive Brokers Group published its financial results for the second quarter of 2026, covering the period from 2026-04-01 to 2026-06-30, in July 2026. Net revenue increased by 28% year on year to US$1.9 billion. A quarterly tracking analysis published by financial markets research provider FM Intelligence on 2026-07-23 showed that the quarter’s revenue growth was driven primarily by an expansion of the balance sheet rather than a rise in interest rates.
(Source: Finance Magnates, analysis of Interactive Brokers’ Q2 2026 results, published 2026-07-23, based on FM Intelligence DataLab quarterly tracking data.)
Growth Structure of the Core Metrics
As of 2026-06-30, Interactive Brokers’ client margin loan balance had reached US$108.5 billion, representing year-on-year growth of 67%. This rate of growth was substantially higher than the corresponding increases in client accounts and client equity, indicating a material rise in leverage usage per account.
Client margin loan balance: US$108.5 billion, up 67% year on year and the highest level recorded during the ten-quarter period covered by the analysis.
Total client accounts: 5.19 million, up 34% year on year.
Total client equity: US$930.3 billion, up 40% year on year.
Average borrowing per account: approximately US$20,900, up around 24% year on year.
Margin loans as a proportion of client equity: 11.7%, the highest reading during the period covered by the analysis.
Divergence Between Net Interest Income and Net Interest Margin
In the second quarter of 2026, Interactive Brokers’ net interest income increased by 23% year on year to US$1.06 billion. Over the same period, however, its net interest margin narrowed from 2.07% a year earlier to 1.93%, marking the sixth consecutive reporting period in which the figure declined on a year-on-year basis. The immediate cause of the narrower margin was a fall in the yield on margin loans to 4.10%.
This combination of figures represents a typical volume-price divergence: the absolute amount of interest income increased because the interest-earning asset base expanded, while the profitability generated per unit of assets continued to decline. In other words, growth in the interest business during the quarter was driven by scale rather than pricing.
Key Financial and Operating Data for Q2 2026
| Metric | Q2 2026 Value | Year-on-Year Change | Data Date |
|---|---|---|---|
| Net revenue | US$1.9 billion | Up 28% | 2026-06-30 |
| Client margin loan balance | US$108.5 billion | Up 67% | 2026-06-30 |
| Number of client accounts | 5.19 million | Up 34% | 2026-06-30 |
| Total client equity | US$930.3 billion | Up 40% | 2026-06-30 |
| Net interest income | US$1.06 billion | Up 23% | 2026-06-30 |
| Net interest margin | 1.93% | Narrowed from 2.07% | 2026-06-30 |
| Yield on margin loans | 4.10% | Down year on year | 2026-06-30 |
| Average borrowing per account | Approximately US$20,900 | Up approximately 24% | 2026-06-30 |
Interest-Rate Sensitivity and the Net Interest Income Outlook for H2 2026
According to the interest-rate sensitivity parameters disclosed by Interactive Brokers, each 0.25 percentage point movement in the US benchmark interest rate would reduce the company’s annual net interest income by approximately US$82 million. Based on this parameter, FM Intelligence estimated a range for the company’s full-year 2026 net interest income.
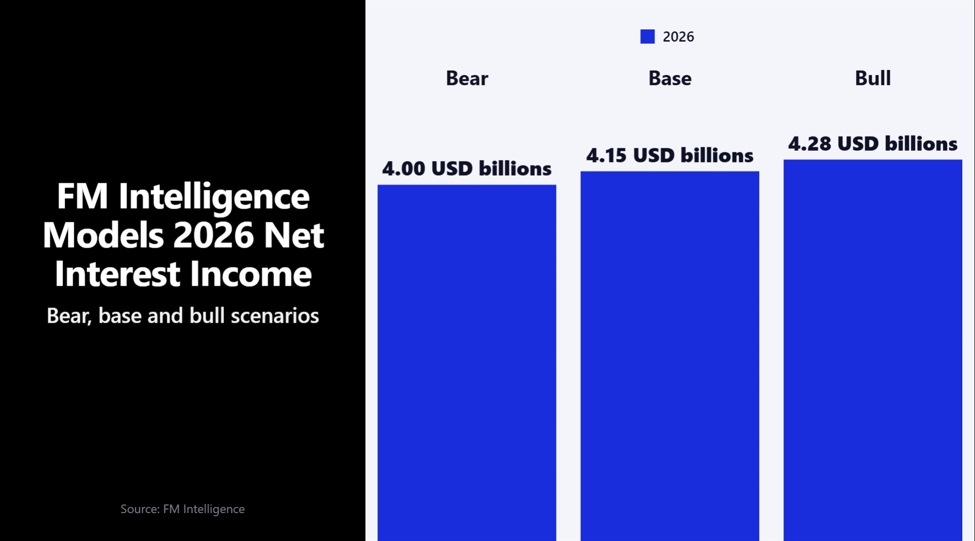
Estimated Results Under Three Interest-Rate Scenarios
Bearish scenario: full-year 2026 net interest income of approximately US$3.95 billion, based on a combination of substantial interest-rate reductions and slower growth in client balances.
Base-case scenario: full-year 2026 net interest income of close to US$4.15 billion, based on interest rates remaining unchanged or fluctuating only slightly, alongside continued growth in client balances at the current pace.
Bullish scenario: full-year 2026 net interest income of approximately US$4.3 billion, based on interest rates remaining elevated and client balances expanding at a faster rate.
The assumptions underlying this estimate have been revised. In 2025, the market broadly expected interest-rate cuts to continue throughout the year, whereas current expectations have shifted towards rates remaining unchanged or rising slightly. The estimated outcome also depends on the rate of growth in client balances, with both variables determining where the final figure falls within the projected range. These figures are model-based forecasts produced by FM Intelligence and do not represent official company guidance.
(Source: Finance Magnates, FM Intelligence scenario analysis of net interest income for the second half of 2026, published 2026-07-23.)
Retail Trading Activity Extends into Digital Assets
The quarterly data also indicated that retail trading activity had expanded beyond equities as a single asset class. Paul Howard, Senior Director at digital-asset liquidity provider Wincent, commented on this development.
Changes in the Structure of Market Participation
Interactive Brokers’ quarterly results indicate that retail investors remained active across equities, commodities and derivatives.
Artificial intelligence-driven trading tools are lowering the barriers to using complex financial products and expanding the pool of potential participants.
The role of digital assets in the market is expected to increase during the second half of the year, driven by capital rotating towards markets that have relatively underperformed during this year’s rally.
“I expect cryptocurrency trading volume to exceed US$100 billion again in the second half of the year.”
This forecast was made before the release of the latest monthly data. According to Finance Magnates in July 2026, retail order volumes rebounded in June 2026, but the cryptocurrency segment did not follow the same trend, creating a short-term divergence from Howard’s outlook for the second half of the year.
(Source: Finance Magnates, monthly analysis of retail trading activity in June 2026, published July 2026.)
Frequently Asked Questions About Interactive Brokers’ Q2 Results
What was the main source of Interactive Brokers’ net revenue growth in Q2 2026?
The main source was the expansion of the company’s balance sheet rather than higher interest rates. Client margin loans increased by 67% year on year to US$108.5 billion, substantially enlarging the interest-earning asset base and driving a 23% increase in net interest income to US$1.06 billion. Over the same period, the net interest margin narrowed from 2.07% to 1.93%, indicating a decline in the earnings generated per unit of assets.
Why did net interest income increase while the net interest margin declined?
Net interest income is an absolute monetary amount, whereas the net interest margin is a relative ratio. When the growth of interest-earning assets, represented by the 67% increase in margin loans, substantially exceeds the decline in yields, with the margin loan yield falling to 4.10%, total income can still rise while the profit margin generated by each unit of assets contracts. This represents a structural combination of higher volume and lower pricing.
What does a margin loan-to-client equity ratio of 11.7% mean?
This ratio measures the overall intensity of leverage used by clients and was the highest reading recorded during the ten-quarter period covered by the analysis. The increase indicates that clients expanded their borrowing at a faster rate than their equity, with average borrowing per account rising by approximately 24% year on year to around US$20,900.
How significantly do US interest-rate movements affect Interactive Brokers’ net interest income?
According to the company’s disclosed interest-rate sensitivity, each 0.25 percentage point movement in the benchmark interest rate would produce a corresponding change of approximately US$82 million in annual net interest income. Based on this parameter, FM Intelligence estimated full-year 2026 net interest income of between US$3.95 billion and US$4.3 billion, with the base-case scenario close to US$4.15 billion.
Is FM Intelligence’s forecast the same as Interactive Brokers’ official guidance?
No. The projected range of US$3.95 billion to US$4.3 billion is based on a model developed by FM Intelligence and is divided into base-case, bullish and bearish scenarios. Its input variables include assumptions about the future interest-rate path and the growth of client balances, and it does not constitute official earnings guidance issued by Interactive Brokers.