Spotware’s cBridge launched its Markout Report module in July 2026, helping brokers identify toxic trading flow in real time through account-level markout analysis, risk scoring, financial impact rankings and integrated routing controls.
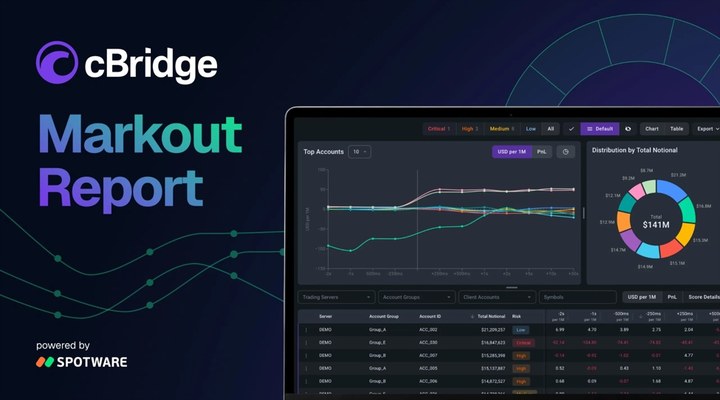
Spotware said its cBridge liquidity bridge platform launched a risk module called Markout Report during the week of 21 July 2026, enabling brokers to continuously monitor potentially toxic trading flow at account level while trading sessions are still under way. The tool tracks post-trade price movements (markout) and pre-trade drift in real time, ranking flagged accounts by financial impact so dealing teams can take action before losses accumulate. (Source: Finance Magnates, Spotware's cBridge Launches Markout Report Module to Flag Toxic Flow, published: 21 July 2026.)
cBridge noted that brokers typically discover execution problems only after a trading session has ended and profit and loss has been settled. By that point, the losses cannot be recovered, leaving the broker with no option other than adjusting the routing of future trades. Markout Report is designed to provide the same signals earlier, identifying them while trading is still in progress. The module was developed internally by Spotware, and its launch followed a consistent sequence of recent developments:
It was launched approximately two weeks after cBridge entered into a partnership with the risk analytics platform Tapaas.
It was launched approximately one week after cBridge added STARPRIME to its liquidity provider network.
cBridge Co-General Manager Alexis Droussiotis explained the positioning of the product.
“We want risk management to become a core part of the liquidity bridge.”
Four Signals Used for Account Risk Scoring
Spotware, the company behind the cTrader platform, previously launched cBridge as a standalone liquidity bridge platform priced according to infrastructure rather than trading volume. The company said Markout Report scores each account using four indicators and assigns it a low, medium, high or very high risk classification. (Source: Finance Magnates, same report as above, citing Spotware’s product description.)
The four scoring signals and their meanings are as follows:
| Signal | What It Measures | Possible Indication | Risk Classification |
|---|---|---|---|
| Post-trade price movement (Markout) | Market price movements after trade execution | Pricing being exploited by faster or better-informed traders | Low / Medium / High / Very High |
| Pre-trade drift | Price movements before trade execution | Information leakage or latency arbitrage | Low / Medium / High / Very High |
| Decay | Changes in the persistence of a signal over time | Temporal stability of the behaviour | Low / Medium / High / Very High |
| Consistency | Recurring patterns in account behaviour | Characteristics of a systematic strategy | Low / Medium / High / Very High |
Post-trade price movement is a standard industry metric used to assess whether a broker’s pricing is being exploited by faster or better-informed traders. Pre-trade drift focuses on price movements before execution, which may indicate information leakage or latency arbitrage. According to cBridge, interactive charts plot account-level indicators across configurable time windows, allowing risk teams to observe behaviour during volatile periods without manually reconstructing individual trades. In addition, the “Accounts of Interest” view ranks flagged accounts by financial impact, while a separate notional distribution view shows how trading volume is concentrated across the account base. The ranking is intended to focus attention on accounts where routing measures could protect broker profitability, rather than on accounts with minimal risk exposure.
Markout Analysis Expands from Institutional to Retail Channels
Markout Report has been introduced as markout analysis, once predominantly used by institutional firms, increasingly becomes a routine component of risk management for retail brokers. During a Finance Magnates London Summit panel discussion in December 2025, Boltzam Research Co-Founder Chariton Christou said retail trading firms were increasingly using tools that had previously been available only to institutions, including spread decay and markout analysis. (Source: Finance Magnates, same report as above, citing remarks made during a December 2025 London Summit panel discussion.)
Recent developments among industry peers integrating risk and execution tools include:
oneZero’s Hub platform has integrated pricing, risk management, order routing and analytics into a single system for its broker clients.
In March 2025, Centroid Solutions embedded its Centroid Risk analytics capabilities, including dashboards for analysing trader behaviour and assessing risk, directly into Match-Trade Technologies’ Match-Trader platform.
In July 2026, cBridge introduced third-party exposure and profit-and-loss analytics into its bridge through its partnership with Tapaas, before subsequently launching the internally developed Markout Report.
Filtering and Routing Within the Same Interface
According to cBridge, once an account has been flagged, teams can filter by instrument or trading conditions to determine whether anomalous behaviour is concentrated in a single product or spread across multiple products. Accounts can also be categorised or pinned to maintain a structured review process. Routing actions can then be initiated for flagged accounts within the same cBridge environment, without exporting the data to a separate tool. (Source: Finance Magnates, same report as above, citing comments by Alexis Droussiotis.)
“As brokers scale, operational management becomes increasingly difficult, and that is what we are trying to solve: giving them room to grow without losing control of risk.”
cBridge said brokers already generate the execution data underlying all of these indicators. The purpose of Markout Report is to make that data available earlier during the trading session, rather than only after the session has ended.
Questions About Spotware cBridge Markout Report
What is the main purpose of the Markout Report module?
The module enables brokers to continuously monitor potentially toxic trading flow at account level while a trading session is still under way. It tracks post-trade price movements and pre-trade drift in real time, ranking flagged accounts by financial impact. This allows dealing teams to act before losses accumulate rather than discovering problems only after the session has ended and profit and loss has been settled.
Which four signals are used to assess account risk?
Accounts are scored using post-trade price movement, or markout, pre-trade drift, decay and consistency, before being classified as low, medium, high or very high risk. Post-trade price movement measures market changes following execution, while pre-trade drift examines price movements before execution.
How is Markout Report related to Tapaas and STARPRIME?
Markout Report was developed internally by Spotware and did not originate from a third party. It was launched approximately two weeks after cBridge established its risk analytics partnership with Tapaas and about one week after cBridge added STARPRIME to its liquidity provider network.
What is distinctive about cBridge’s pricing model?
cBridge is a standalone liquidity bridge platform priced according to infrastructure rather than trading volume. This means a broker’s costs do not automatically increase as its clients’ trading activity grows.
What can brokers do after an account has been flagged?
Teams can filter accounts by instrument or trading conditions to determine whether anomalous behaviour is concentrated in one product or spread across multiple products. They can also categorise or pin accounts for structured review. Routing actions can then be initiated directly within the same cBridge environment without exporting data to a separate tool.