Retail forex and CFD broker volumes fell 9.3% quarter on quarter to $30.4 trillion in Q2 2026, while annual volumes remained broadly stable and EC Markets moved to the top of the industry ranking.
Retail CFD Broker Trading Volumes Fall 9% Quarter on Quarter to $30.4 Trillion in Q2 2026
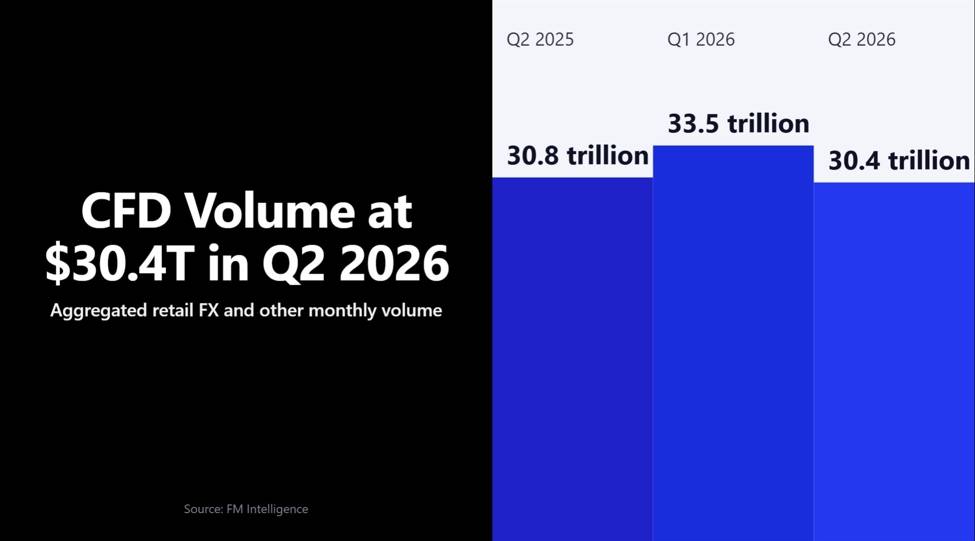
According to FM Intelligence data, monthly forex and other trading volumes reported by retail brokers totalled $30.4 trillion in the second quarter of 2026. This represented a 9.3% decline from $33.5 trillion in the first quarter, but a decrease of only 1.4% compared with the same period last year. The quarter-on-quarter decline therefore appears to be a pullback from the first-quarter peak rather than the start of a sustained downward trend.(Source: FM Intelligence, Q2 2026 Retail Broker Volumes Analysis, published: 2026-07-21.)
In terms of overall scale, this was the first decline recorded by the retail forex and contracts for difference (CFD) industry following a series of record highs at the beginning of 2026. First-quarter volumes of $33.5 trillion set an all-time high, while the decline to approximately $30.45 trillion this quarter remained within the normal range of fluctuations seen over the past year.
Annual Volumes Remain Stable as Rankings Shift
Although total annual volumes remained broadly stable, the ranking order changed, while two sets of data pointed in opposite directions:
Among the top 21 brokers, 18 reported lower trading volumes than in the first quarter.
By contrast, all of the top 10 brokers recorded higher trading volumes than in the same period last year.
This divergence indicates that the headline figure conceals more than it reveals, as continued expansion among leading brokers occurred alongside quarter-on-quarter declines among brokers further down the ranking.
New Market Leader Generates Very Little Volume from Forex
EC Markets ranked first this quarter, having placed fourth in the second quarter of 2025. Its total monthly trading volume more than doubled within a year, lifting it to the top position, while the broker that ranked first a year earlier fell to third place. According to the FM Intelligence report, EC Markets led all brokers with average monthly trading volume of $2.11 trillion.(Source: FM Intelligence, Q2 2026 Report / Two Brokers Cross $2 Trillion Monthly Volume Mark, published: 2026-07.)
The ranking combines forex and other trading volumes, while other asset classes accounted for the vast majority of activity among the current market leaders. The trading volume composition of the leading brokers was as follows:
| Ranking | Non-Forex Products | Forex Products | Ranking a Year Earlier |
|---|---|---|---|
| 1st | Approximately 97% | Approximately 3% | 4th |
| 2nd | Approximately 99% | Approximately 1% | — |
| 3rd | Approximately 99% | Approximately 1% | 1st |
| Industry total | $30.4 trillion in monthly volume | Quarter on quarter: -9.3% | Year on year: -1.4% |
Approximately 97% of the first-ranked company’s trading volume came from products other than forex, including share, index, commodity and cryptocurrency CFDs. Among its two closest competitors, this proportion was even higher at approximately 99%. This raises a question that the headline volume figure alone cannot answer: how much of the trading activity at the top of the retail broker rankings relates to forex, and how much comes from other asset classes?
Transition in Data Services and Reporting Methodology
This quarter’s data came from the final PDF edition of the Finance Magnates Quarterly Intelligence Report, which is being transitioned into a continuously updated data service. Broker trading volumes, rankings, market analysis and industry insights are being moved to Finance Magnates Data Lab, where chart data will be updated on an ongoing basis rather than published only once per quarter.(Source: FM Intelligence, Q2 2026 Intelligence Report Released, published: 2026-07.)
When interpreting this quarter’s rankings, readers should consider the following points regarding the scope of the data:
Confirm that the rankings combine forex and other trading volumes, with the leading positions primarily driven by non-forex products.
Distinguish between quarter-on-quarter and year-on-year changes: the 9.3% quarterly decline reflects a pullback from a high point, while the annual decline of only 1.4% indicates that overall volumes remained broadly stable.
Consider the divergence between the top 10 and top 21 brokers, which reflects a structural difference between growth among market leaders and declines among lower-ranked firms.
Questions About Retail Broker Trading Volumes
Why did retail broker trading volumes decline in the second quarter of 2026?
According to FM Intelligence, monthly trading volume totalled $30.4 trillion in the second quarter, down 9.3% from $33.5 trillion in the first quarter. The decline primarily reflects a pullback from the first quarter’s record high. The year-on-year decrease was only 1.4%, indicating that annual trading activity remained broadly stable.
Which broker ranked first this quarter?
EC Markets ranked first. The company placed fourth in the second quarter of 2025, but more than doubled its total monthly trading volume within a year to reach an average of approximately $2.11 trillion. The broker that led the ranking a year earlier fell to third place.
Why is the leading broker described as conducting very little forex trading?
The ranking combines forex and other trading volumes. Approximately 97% of the first-ranked company’s activity came from non-forex products, including share, index, commodity and cryptocurrency CFDs, while only around 3% came from forex. Among its two closest competitors, non-forex products accounted for approximately 99% of trading volume.
How can leading brokers grow while overall volumes decline?
Among the top 21 brokers, 18 recorded lower trading volumes than in the previous quarter, while all of the top 10 brokers remained above their levels from the same period last year. This indicates that leading brokers continued to expand while firms further down the ranking experienced declines. The combined headline figure therefore conceals significant structural differences within the market.
Where will these data be available in future?
This quarter marked the final PDF edition of the Quarterly Intelligence Report. The data are being migrated to Finance Magnates Data Lab, where broker trading volumes, rankings and market analysis will be published through continuous updates rather than a single quarterly release.